
NOAA/NWS Storm Prediction Center, Norman, Oklahoma
A conceptual model for sustained low-level mesocyclones is tested as a tornado forecast tool
with observations and forecasts from the operational Eta model. In the conceptual model, a
balance between low-level storm inflow and outflow allows the development of a persistent low-level mesocyclone along the rear flank of a supercell thunderstorm, owing largely to the strength
of the midlevel storm-relative winds. The present work draws on this conceptual model to identify
preferred ranges of low (model surface level), middle (500 mb) and upper-level (250 mb) storm-relative wind speeds for 131 supercells, from gridded Eta model fields. The observations reveal
that the 500 mb storm-relative wind speed has a distinct lower bound of approximately 8 ms
Prediction of tornadoes has presented a great challenge to meteorologists since the inception of modern severe thunderstorm forecasting. Pioneering efforts of the Air Weather Service in the late 1940s and early 1950s led to a methodology of forecasting tornadoes (e.g., Fawbush et al. 1951) based on a checklist of parameters to diagnose atmospheric stability and wind structure, much of which remains in use today. Later work in the 1950s focused on so-called proximity soundings to reveal thermodynamic characteristics of the tornadic thunderstorm environment (Fawbush and Miller 1952, 1954; Beebe 1958), such as the Miller type I "loaded gun" sounding (not shown). These studies led to analyses of vertical wind profiles in proximity to tornadic thunderstorms (e.g., Darkow 1969; Darkow and Fowler 1971), as well as to understanding the characteristics of environmental storm-relative winds associated with tornadic and nontornadic severe thunderstorms (Maddox 1976).
Severe thunderstorm research conducted during recent years has refined our understanding of the relationships between supercell thunderstorms (those with persistent mesocyclones) and the ambient vertical wind shear. Theoretical studies (Davies-Jones 1984; Lilly 1986) have demonstrated the relationship between low-level (approximately 0-2 or 0-3 km above ground level) storm-relative helicity (hereafter SRH) and midlevel (approximately 3-6 km above ground level) mesocyclones in supercell thunderstorms. Other theoretical studies (e.g., Rotunno and Klemp 1985) and numerical modeling (e.g., Weisman and Klemp 1982, 1984) have revealed the link between supercells and vertical shear from the low to midlevels. SRH has been used routinely as a tornado forecast tool (Davies-Jones et al. 1990) since the early 1990s, though SRH more accurately identifies supercell environments (Brooks et al. 1993). A combination of convective available potential energy (CAPE) and SRH has also served as a tornado forecast tool (Johns et al. 1993), via the Energy-Helicity Index (EHI, Hart and Korotky 1991; Davies 1993). The bulk Richardson number (BRN, Weisman and Klemp 1982) shear has also been used effectively to identify supercell environments (e.g., Weisman and Klemp 1982, 1984, 1986; Droegemeier et al. 1993; Jahn and Droegemeier 1996). More recently, the shear term from the BRN has been applied to numerical mesoscale model forecasts with the goal of discriminating between tornadic and nontornadic thunderstorm environments (Weisman and Klemp 1982; Stensrud et al. 1997, hereafter SCB97). In the BRN denominator, as calculated by SCB97, Uavg is defined as the magnitude of the difference between the 0-6 km density-weighted mean wind and the density-weighted mean wind in the lowest 0.5 km:
Numerical simulations of supercells have begun to elucidate processes relevant to supercell tornadogenesis, and the Verification of the Origins of Rotation in Tornadoes Experiment (VORTEX; Rasmussen et al. 1994) has provided detailed measurements near and within tornadic supercells. Significant contributions to understanding tornadogenesis have been presented by Klemp and Rotunno (1983), Rotunno and Klemp (1985), Klemp (1987), Wicker and Wilhelmson (1995), and Wicker (1996), among others. These studies emphasize the characteristics of the environmental and storm-induced wind shear profiles, especially at low levels (e.g., 0-500 m above ground level). Specifically, low-level vertical wind shear along the forward flank baroclinic zone of a supercell, as well as generation of horizontal baroclinic vorticity, have been linked to the strength of the low-level mesocyclone. Detailed, high-resolution observations and forecasts of low-level vertical wind profiles would be necessary to test these conceptual models in forecast operations, but such data are generally unavailable to operational meteorologists. The present study focuses on another conceptual model for sustained low-level mesocyclones with tornadic supercells proposed by Davies-Jones and Brooks (1993). This conceptual model focuses on the importance of the storm-relative midlevel winds to create a balance between low-level storm inflow (Droegemeier et al. 1993, hereafter DLD93) and low-level outflow near the rear flank of a supercell thunderstorm. The strength of the low-level outflow along the rear flank of a supercell is modulated by the tendency for precipitation to advect downwind from the mesocyclone or become wrapped around the storm updraft. At one extreme, weak storm-relative winds in the midlevels allow a large amount of precipitation to wrap around the mesocyclone within a supercell thunderstorm, leading to the generation of excessive rain-cooled outflow along the rear flank of the supercell. This rain-cooled air often "undercuts" the midlevel mesocyclone and disrupts the low-level mesocyclone and the production of long-lived or multiple supercell tornadoes. At the other extreme, excessive storm-relative wind speeds in the midlevels remove too much precipitation downwind from the midlevel mesocyclone, which inhibits the development of rain-cooled outflow along the rear flank of a supercell. This rain-cooled downdraft along the rear flank of the storm is associated with baroclinic vorticity generation, and may ultimately serve as a source for vertical vorticity near the ground for the low-level mesocyclone. Therefore, low-level vorticity production is limited if little rain-cooled outflow is present along the rear flank of a supercell. Between these extremes a balance can exist between the production of vertical vorticity in the downdraft along the rear flank and the tendency for this downdraft to undercut the supercell in the low levels. It is implied by Davies-Jones and Brooks (1993) that supercells producing multiple and/or long-lived tornadoes fall in this middle range where the rear flank downdraft is pronounced and balanced by storm inflow. Such a supercell structure appears to favor the repeated production of tornadoes.
The present work follows that of Davies-Jones and Brooks (1993), Brooks et al. (1994a; hereafter BDW94) and Brooks et al. (1994b; hereafter BDC94). Consideration of storm inflow and middle/upper-level storm-relative wind speeds appears to provide a more complete picture of the environment favoring supercells with sustained low-level mesocyclones and tornadoes than do BRN, SRH or EHI, which are more specifically associated with midlevel mesocyclones. A methodology of documenting analyses and testing forecasts of storm-relative wind speeds in the low, middle and upper levels is developed using output from the Eta model (Black 1994) over the conterminous United States. Results of the twenty-two month period of study are presented with a discussion of applicability to operational forecasting of tornadic supercells.
The 80 km horizontal resolution "early" Eta model run was chosen to test the storm-relative conceptual model for tornadic supercells. These forecast data are widely available to National Weather Service field offices through the Personal Computer based Gridded Interactive Display and Diagnostic System (PCGRIDDS; Meier 1994). The horizontal resolution of the Eta model changed to 48 km in October 1995, although the PCGRIDDS display resolution remained unchanged. Eighty-one of the 131 supercell cases occurred after the Eta model resolution change, but this resolution change in the Eta model did not have a noticeable impact on the PCGRIDDS diagnoses or forecasts of storm-relative wind speed. Eta model storm-relative (hereafter SR) wind speeds were evaluated for both tornadic and nontornadic supercells; SR wind speeds were calculated from Eta model initial hour PCGRIDDS data based on observed supercell motions. Given the many problems associated with choosing proximity soundings (see BDC94) and with data availability, the Eta initial hour analyses were used in lieu of soundings to diagnose SR wind speeds. Based on the results of this diagnostic assessment of supercells from 1995 and 1996, Eta model forecasts of SR wind speeds were evaluated for a subset of supercell cases from 1995. Eta model forecast data were not available for many of the 1996 cases, thus limiting the forecast evaluation to 1995 cases.
The low, middle and upper-level SR wind speeds were defined in terms of available terrain following surfaces or pressure levels in PCGRIDDS. Low-level inflow was set at the Eta model surface level (located 15 mb "above" the model ground, hereafter referred to as the surface level) , while midlevel relative wind speed was calculated at 500 mb. These are crude approximations to 0-2 km inflow (DLD93) and 2-9 km relative flow (BDC94), limited by the coarse vertical resolution of the Eta model PCGRIDDS data. The anvil-level relative wind speed (Rasmussen and Straka 1997) was calculated at 250 mb. Anvil-level relative flow may be important to precipitation efficiency and rainfall distribution in supercells. Storm-relative winds near the anvil may largely determine whether developing precipitation particles form and fall out near the main storm updraft or are advected downwind in the anvil (Rasmussen and Straka 1997). Additionally, the BRN shear was modified to fit the PCGRIDDS data. The 0-6 km and 0-0.5 km density-weighted mean winds of the BRN shear were replaced with the Eta surface-level to 400 mb density-weighted mean wind and the surface-level wind, respectively.
Tornadic and nontornadic supercell cases were collected for the twenty-two month period beginning in November 1994 and ending in August 1996. To be considered, the following criteria must have been met:
2) The supercell must have occurred within three hours of an Eta model initialization (i.e., between 0900-1500 or 2100-0300 UTC).
3) PCGRIDDS data were available for the Eta model initialization.
Actual storm motion was calculated from radar reflectivity mosaics by tracking the reflectivity centroid for one hour, centered on the times of tornado report(s) or the most pronounced radar signatures if nontornadic. This storm motion was then used to calculate the storm-relative wind speed for the surface level, 500 mb and 250 mb with the initial hour Eta model winds for the closest grid point to the supercell.
Locations of model grid points associated with 131 supercell cases are depicted in Figure 1. A majority of the supercells occurred across the central and southern Great Plains, with the greatest concentration near the Texas/Oklahoma border. The prevalence of southern Plains supercells in this database represents the tendency for Plains supercells to occur during the data collection time in this study (namely 2100-0300 UTC). Some supercells over the High Plains developed too late in the evening to be considered, and a few supercells east of the Mississippi River dissipated prior to 2100 UTC. Only four supercells in this study occurred during the morning time period (0900-1500 UTC). Not surprisingly, the majority of the southern Plains supercells occurred from April-June, while most of the supercells from Colorado to Minnesota occurred during June and July. The supercells affecting the Gulf Coast and southeast Atlantic Coast areas occurred during the cool season from late October to mid-April.
Storm Data was the preferred source for tornado reports, although Storm Data was not yet available for the 1996 cases. Thus, the Storm Prediction Center (SPC) Rough Log of severe weather reports became a substitute. Several difficulties were encountered in distinguishing between tornadic and nontornadic supercells, as well as supercell and nonsupercell tornadoes. The latter were addressed by assuming tornadoes were supercellular only if a storm was identified as a supercell 15 minutes prior to the first tornado report with the storm. This check does not guarantee a particular tornado was indeed supercellular. However, this criterion reduces the chance of falsely identifying a nonsupercell tornado as supercellular, namely when radar signatures similar to a supercell evolve simultaneously with a nonsupercell tornado (Wakimoto and Wilson 1989). Also, a supercell cannot be classified as nontornadic with complete certainty. Darkness, remote areas, and a lack of damage can all preclude a tornado from being reported. Doswell and Burgess (1988) discuss many issues related to the quality of tornado reports in Storm Data.
Twenty of the supercells in this study produced a single tornado, with the tornadoes described as being "brief " or as producing no damage. Classifying supercells as tornadic based on such reports seemed an inadequate means of testing a conceptual model for sustained low-level mesocyclones. To more clearly infer the influence of SR wind speed in sustaining low-level mesocyclones and associated tornadoes, supercells were classified as tornadic when the indication was unambiguous. For this study, a supercell was designated tornadic on the basis of multiple tornado reports and/or the occurrence of a long-lived (> 15 minutes) tornado. Supercells with only a single brief/weak tornado were included in the nontornadic category since the conceptual model does not preclude a brief tornado without a long-lived mesocyclone in the low levels.
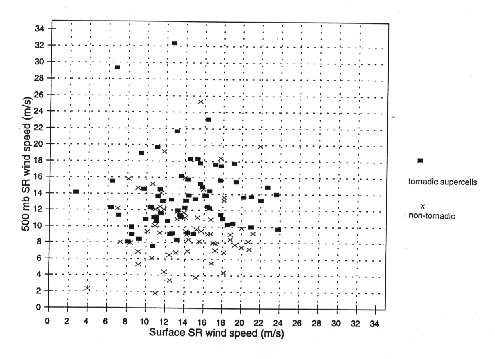
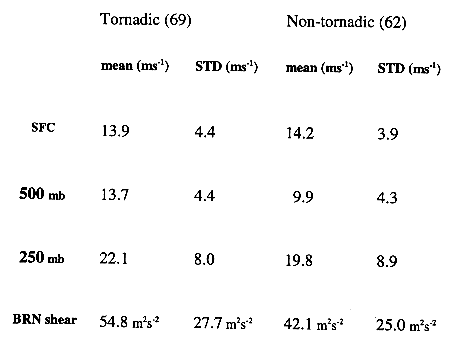
The SR wind magnitudes were calculated for the surface level, 500 mb and 250 mb for the tornadic and nontornadic supercells. Scatter diagrams of the SR wind speeds and BRN shear are presented in Figures 2a-c.
a. Surface-level and 500 mb SR wind speeds
The surface-level SR wind speed plots are similar for the tornadic and nontornadic supercells,
but important differences stand out at 500 mb. Figure 2a shows a similar clustering of nontornadic
values to that of the tornadic supercells at the surface, with substantial overlap between the two
groups at 500 mb. The range of surface-level SR wind speeds is very similar for both the tornadic
and nontornadic storms, with mean values near 14 ms
 2a
2a
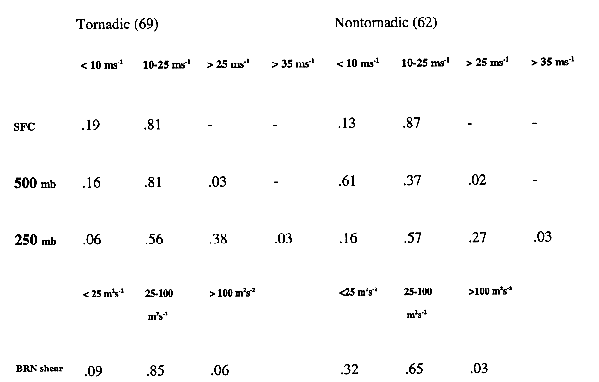
A categorization of SR wind speeds with the tornadic and nontornadic supercells is shown in
Table 2. It is noteworthy that 61% (38 of 62) of the nontornadic supercells were associated with 500
mb SR wind speeds less than 10 ms
The analysis suggests that 500 mb SR wind speed best differentiates between the tornadic and
nontornadic supercells in this study. It is also important to note that while all of the tornadic
supercells were associated with 500 mb SR wind speed of 7.9 ms
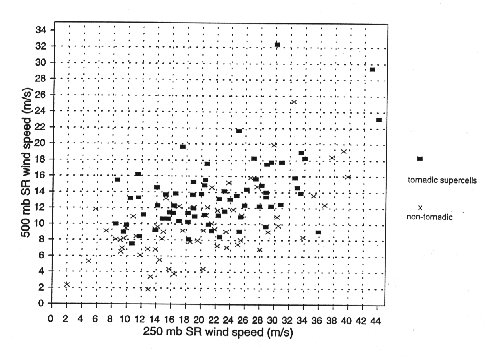
b. SR wind speeds at 250 mb
The 250 mb SR wind speeds cover a similar range of values for both the nontornadic and
tornadic supercells (Fig. 2b). At 250 mb, SR wind magnitudes are well-distributed between a lower
bound around 8 ms
 2b
2b
c. BRN shear versus 500 mb SR wind speed
A comparison of 500 mb SR wind speeds to the BRN shear for the tornadic and nontornadic supercells is displayed in Fig. 2c. The BRN shear displays an approximate lower bound for the tornadic supercells near 25 m2s-2, and only 6% of the values are greater than 100 m2s-2. This range of BRN shear values from 25-100 m2s-2 is in general agreement with the range of values proposed by SCB97 for tornadic storms. BRN shear magnitudes for the nontornadic supercells were generally less than with the tornadic supercells, with a clustering of values from about 20-50 m2s-2 (Fig. 2c). The lower BRN shear values reflect the weaker environmental wind shear associated with the nontornadic supercells, but a relatively large percentage (39%) of nontornadic cases still exceed the lower bound of 40 m2s-2 used by SCB97 to forecast tornadic supercells.
Care must be given in interpreting differences in the BRN shear values from different numerical
models (e.g., Eta vs. the fourth-generation Penn State/NCAR Mesoscale Model (MM4) used by
SCB97). The BRN shear term is sensitive to low-level winds and, in turn, sensitive to the boundary-layer parameterization. Also, the vertical resolution of the Eta PCGRIDDS data available for this
study is courser than the MM4 model, and can introduce errors in BRN shear calculations. One
might expect a general increase in 500 mb SR wind speed with increasing BRN shear since BRN
shear depends largely on midlevel wind speed. However, the stronger vertical wind shear associated
with larger BRN shear values often contributes to a faster storm motion, thus the relationship
between BRN shear and 500 mb SR wind speed is not necessarily straightforward. Fig. 2c shows
only a slight tendency for SR wind speed at 500 mb to increase as BRN shear increases (linear
correlation coefficient of 0.30 for the tornadic supercells and 0.44 for combined tornadic and
nontornadic). Therefore, caution is advised when using the methodology of SCB97 where BRN
shear serves as a surrogate for midlevel SR wind speed. However, 500 mb SR wind speeds (for this
data set) are generally 8 ms
 2c
2c
Two basic forecast parameters were evaluated with the Eta model PCGRIDDS data using vector differences with an estimated storm motion: SR wind speed at the model surface level, and SR wind speed at 500 mb. The parameters of surface-level and 500 mb SR wind speed were combined with an arbitrary CAPE threshold of 500 Jkg-1 in PCGRIDDS to delineate areas favorable for supercells with sustained low-level mesocylones and associated tornadoes. Using the location of the closest grid point to each tornadic and "nontornadic" supercell, SR wind speeds were calculated for the 24 and 12 hour forecasts valid at the time of the initial hour analysis (00 UTC in 127 of 131 cases).
The lower limits of favorable surface-level and 500 mb SR wind speed for tornadic supercells
were defined as 8 ms
An estimated storm motion is necessary when examining forecasts of SR wind speeds and processes related to supercell tornadogenesis, and an assumed deviant motion is relevant since this SR technique assumes the presence of a supercell. Forecasting supercells is a somewhat different problem than identifying the potential for tornadic supercells, and a detailed discussion on some problems with forecasting supercells based on storm-relative shear parameters can be found in Weisman (1996). To determine storm motion a priori, a motion of 30 degrees right and 75% of the 1000-500 mb mean wind speed is assumed (after Maddox 1976). For the High Plains (defined as west of 100 degrees west longitude), the Eta model 1000 mb and 850 mb winds are basically the same, so storm motion estimates for this region were based on the 850-400 mb mean wind. This assumed motion of the supercells can be in error when the wind profile does not lie in the upper right quadrant of the hodograph, as discussed by Weisman and Klemp (1986) and Weisman (1996). For example, Weisman and Klemp (1986) present various wind profiles and associated storm motions (refer to their Fig. 15.16). In part (b) of the figure (with a wind profile in the lower portions of the hodograph), the rightward supercell motion is actually faster than the mean wind, similar to a left moving (anticyclonic) supercell with a wind profile in the upper right portion of the hodograph.
Forecast data were collected and analyzed for January through December of 1995. The diagnostic
assessment led to the proposed SR wind speed guidelines for tornadic supercells, namely the lower
bounds to surface-level and 500 mb SR wind speed of 8 ms
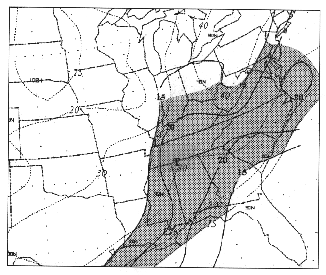

The 21 July 1995 and 23 July 1995 cases (Figs. 5 and 6, respectively) are forecasts for less
"synoptically evident" (see Johns and Doswell 1992) events than the two previous examples. During
the evening hours of 21 July 1995, several supercells produced 14 tornadoes (8 resulted in F1-F2
damage) in the vicinity of Minneapolis, MN. The large scale pattern consisted of 15-20 ms

An example of a subtle supercell tornado forecast case (23 July 1995) is given in Fig. 6, which
consisted of several tornadic supercells near a convective outflow boundary from the eastern Texas
Panhandle to the southwest corner of Oklahoma. The 12 hour forecast shows sufficient inflow for
sustained tornadic supercells over parts of southern and southwest Oklahoma, but not as far
northwest as the eastern Texas Panhandle (Fig 6). However, wind profiles from Frederick, OK and
Amarillo, TX (not shown) indicated greater than 12 ms

Forecast statistics were computed for 51 of the 1995 supercell cases (28 tornadic, 23
nontornadic) included in the diagnostic assessment, based on availability of 24 and 12 hour
PCGRIDDS forecast data for the initial hour analysis time. The forecast was for tornadic supercells
(as described in Section 2) when surface-level and 500 mb SR wind speeds were forecast to be
greater than 8 ms

The 8 ms
a. Forecast error statistics
Error statistics were compiled for the 1995 forecast cases included in the diagnostic evaluation. SR wind speed and CAPE (most unstable parcel in lowest 70 mb) forecasts for the subset of 51 supercells (28 tornadic, 23 nontornadic) from 1995 were calculated at the same grid points used in the diagnostic evaluation. SR wind speeds, based on the initial hour Eta wind analyses and observed storm motions, and CAPE were subtracted from 24, 12 and initial hour forecasts based on the assumed storm motion 30 degrees to the right and 75% of the 1000-500 mb mean wind (850-400 mb mean wind for the High Plains region). In addition, magnitude (i.e. percent of 1000-500 mb mean speed) and direction errors were calculated at each supercell grid point by comparing the assumed motion with the observed storm motion.
Error statistics are summarized in Table 4. SR wind speed forecasts at 500 mb displayed only
small negative biases for the entire group of tornadic and nontornadic supercells, with mean errors
near -2.0 ms

Standard deviations of forecast errors ranged from near 4 ms
 7a
7a
 7b
7b
 7c
7c
 7d
7d
Magnitude and direction errors revealed several biases inherent to the assumed storm motion in this study. The tornadic supercells closely matched the assumed motion, with a mean deviation of 31 degrees to the right and a speed 82% of the 1000-500 mb mean wind. However, the mean nontornadic supercell motion was faster (119% of the 1000-500 mb mean speed) and more to the right (37 degrees). The faster and more deviant rightward motion of the nontornadic storms explains the tendency to underestimate surface-level SR wind speed. It appears the Eta model tended to underforecast 500 mb wind speeds, which supports the tendency of 500 mb SR wind speeds to be underforecast for the tornadic supercells. Though no significant bias was noted in 500 mb SR wind speed forecasts for the nontornadic supercells, it appears likely that the observed faster storm motions were generally offset by stronger than forecast 500 mb wind speeds.
Of the three SR parameters examined, the 500 mb SR wind speed distinguished the tornadic
supercells most successfully. A sharp lower bound to the 500 mb SR wind speed is apparent in Fig.
2a (~ 8ms
Colquhoun and Riley (1996) found the surface to 600 mb shear magnitude to be the parameter best correlated to tornado "intensity" (F-scale damage rating) in their tornado proximity sounding database. Similar to the BRN shear, the surface to 600 mb shear is even more heavily influenced by midlevel wind speeds.
It is important to note that substantial overlap exists between the SR wind speeds for the tornadic
and nontornadic supercells. The 500 mb SR wind speeds for many of the nontornadic supercells fall
well within the cluster of SR wind speeds associated with the tornadic supercells, meaning the SR
conceptual model does not guarantee a supercell will produce tornadoes. On the other hand, weak
500 mb SR wind speed (< 8ms
The surface-level SR wind speed was relatively weak (< 10 ms
A better approach to forecasting low-level SR wind speed will come through layer averaging of SR wind speeds using higher resolution model output (such as in the April 1996 release of PCGRIDDS). Other improvements can result from more accurate storm motion estimates.
Based on diagnostic and forecast results from late 1994 through summer 1996, the Eta model SR
wind speed forecast scheme exhibits skill in identifying and forecasting large-scale environments
that favor supercell tornadoes. Important aspects of the forecasts are consistency in the forecast areas
from one model run to the next, and trends in the SR wind speed forecast areas. For 85% of the 1995
forecast cases where tornadic storms were observed, areas of sufficient (> 8 ms1) SR wind speed
overlap for the surface and 500 mb were clearly maintained from the 24 to 12 hour forecast. No
major systematic problems were noted in forecasts of the SR wind speeds, though forecast error
statistics suggest a slight tendency for this technique and the Eta model to underforecast 500 mb SR
wind speed for the tornadic cases and surface-level SR wind speed for the nontornadic cases, while
there is a slight tendency to overforecast surface-level SR wind speed for the tornadic storms. The
forecaster should be especially aware of supercell tornado potential when 500 mb SR wind speed
is forecast to be sufficient (> 8 ms
Though SR wind speed forecasts enable reliable forecasts of supercell tornado potential, several other important factors must be considered when utilizing the PCGRIDDS output:
2) Assess the potential for supercell thunderstorms, without which the present SR wind speed technique is irrelevant.
3) Examine the spatial relationships of the various parameters, especially the surface-level and
500 mb SR wind speed. Cases were documented where the regions of 8 ms
4) Consider the temporal evolution of the SR wind speed areas. Several events were documented where the SR wind speeds were not forecast to be in phase at the beginning of a supercell tornado episode, but juxtapositioning of parameters increased with time.
5) Verify the storm motion estimate when examining numerical model output. Once a storm develops, a simple check of storm motions from radar data can quickly alert a forecaster when SR wind speeds may vary substantially from an Eta model PCGRIDDS forecast.
6) Verify model CAPE forecasts by any available means. Areas forecast to have favorable SR wind speeds, but not supercells, may change.
7) Always remember that other processes contribute to supercell tornadogenesis. The PCGRIDDS analyses can account only for processes resolved by the Eta model, and the proposed "thresholds" of SR wind speed in the PCGRIDDS output are not infallible magic numbers.
Consideration of forecast and observed storm-relative shear profiles could also lend confidence or encourage scrutiny in the tornado warning process, especially for warnings based primarily on WSR-88D imagery and algorithm output. It is suspected that the SR wind speed forecasts could help forecasters determine whether or not supercell tornadoes are a major threat with a given scenario. However, it is unclear that the SR conceptual model can enable a forecaster to distinguish between a particular tornadic or nontornadic supercell in warning operations. The SR conceptual model and forecasts may best help forecasters distinguish between situations when supercell tornadoes are more likely and tornado warnings should be considered seriously for any supercells that develop, or when supercells are more likely to be nontornadic and severe thunderstorm warnings may be more appropriate.
A conceptual model for sustained low-level mesocyclones with tornadic supercells (after
Davies-Jones and Brooks (1993), BDC94 and BDW94) was tested using observations and forecasts
with the Eta model. Supercell motions from radar imagery and Eta initial analyses provided a
diagnostic assessment of surface-level, 500 and 250 mb SR wind speeds with both tornadic and
nontornadic supercells. These observations yielded a well-defined lower bound to the 500 mb SR
wind speed (~8 ms
Storm-relative wind speed forecasts from PCGRIDDS analyses of Eta model data have also
shown skill in delineating areas of supercell tornado potential. The forecast test utilized a lower
bound of 8 ms
The original PCGRIDDS technique has been modified to calculate layer average SR wind speed
with the new version of PCGRIDDS released in April 1996, and informal evaluations suggest the
layer average quantities are consistent with (and perhaps superior to) the mandatory-level
parameters. The PCGRIDDS "macro" used in this study, and updated versions, can be downloaded
from the Storm Prediction Center homepage on the World Wide Web
Acknowledgments. The author would like to thank Steve Weiss of the Storm Prediction Center
(SPC) for constructing the original PCGRIDDS "macro", and for constant encouragement during
this project. The thorough and conscientious efforts of three anonymous reviewers clarified the
manuscript, and enhanced the findings of this study. Others of the SPC who aided in data collection
and reviewed the manuscript: Steve Corfidi, Roger Edwards, Jeff Evans, John Hart, Paul Janish,
Bob Johns, Mike Rehbein, Joe Rogash, Joe Schaefer and Mike Vescio. Thanks also to Harold
Brooks, Erik Rasmussen and Chuck Doswell (all with NSSL) for their helpful discussions.
Beebe, R. G., 1958: Tornado proximity soundings. Bull. Amer. Meteor. Soc., 39, 195-201.
Black, T. L., 1994: The new NMC mesoscale Eta model: Description and forecast examples. Wea.
Forecasting, 9, 265-278.
Bluestein, H. B., and C. R. Parks, 1983: A synoptic and photographic climatology of low-precipitation severe thunderstorms in the southern Plains. Mon. Wea. Rev., 111, 2034-2046.
Branick, M. L., and C. A. Doswell III, 1992: An observation of the relationship between supercell
structure and lightning ground-strike polarity. Wea. Forecasting, 7, 143-149.
Brooks, H. E., C. A. Doswell III, and R. Davies-Jones, 1993: Environmental helicity and the
maintenance and evolution of low-level mesocyclones. The Tornado: Its Structure, Dynamics,
Prediction and Hazards, Geophys. Monogr., No 79, Amer. Geophys. Union, 97-104.
_____, C. A. Doswell III, and R. B. Wilhelmson, 1994a: The role of midtropospheric winds in the
evolution and maintenance of low-level mesocyclones. Mon. Wea. Rev., 122, 126-136.
_____, C. A. Doswell III, and J. Cooper, 1994b: On the environments of tornadic and nontornadic
mesocyclones. Wea. Forecasting, 9, 606-618.
Browning, K. A., 1964: Airflow and precipitation trajectories within severe local storms which travel
to the right of the winds. J. Atmos. Sci., 21, 634-639.
Colquhoun, J. R., and P. A. Riley, 1996: Relationships between tornado intensity and various wind
and thermodynamic variables. Wea. Forecasting, 11, 360-371.
Darkow, G. L., 1969: An analysis of over sixty tornado proximity soundings. Preprints, 6th Conf.
on Severe Local Storms, Chicago, IL, Amer. Meteor. Soc., 218-221.
_____, and M. G. Fowler, 1971: Tornado proximity sounding wind analysis. Preprints, 7th Conf.
on Severe Local Storms, Kansas City, MO, Amer. Meteor. Soc., 148-151.
Davies, J. M., 1993: Hourly helicity, instability, and EHI in forecasting supercell tornadoes.
Preprints, 17th Conf. on Severe Local Storms, Saint Louis, MO, Amer. Meteor. Soc., 107-111.
Davies-Jones, R., 1984: Streamwise vorticity: The origin of updraft rotation in supercell storms.
J. Atmos. Sci., 41, 2991-3006.
_____, and H. E. Brooks, 1993: Mesocyclogenesis from a theoretical perspective. The Tornado:
Its Structure, Dynamics, Prediction and Hazards, Geophys. Monogr., No 79, Amer. Geophys.
Union, 105-114.
_____, D. Burgess, and M. Foster, 1990: Test of helicity as a tornado forecast parameter. Preprints,
16th Conf. on Severe Local Storms, Kananaskis Park, Alberta, Canada, Amer. Meteor. Soc., 588-592.
Doswell, C. A. III, and D. W. Burgess, 1988: On some issues of United States tornado climatology.
Mon. Wea. Rev., 116, 495-501.
_____, and R. Davies-Jones, and D. L. Keller, 1990: On summary measures of skill in rare event
forecasting based on contingency tables. Wea. Forecasting, 5, 576-585.
_____, A. R. Moller, and R. Pryzbylinski, 1990: A unified set of conceptual models for variations
on the supercell theme. Preprints, 16th Conf. on Severe Local Storms, Kananaskis Park, Alberta,
Canada, Amer. Meteor. Soc., 40-45.
_____, and D. W. Burgess, 1993: Tornadoes and tornadic storms: A review of conceptual models.
The Tornado: Its Structure, Dynamics, Prediction and Hazards, Geophys. Monogr., No. 79, Amer.
Geophys Union, 161-172.
Droegemeier, K. K., S. M. Lazarus, and R. Davies-Jones, 1993: The influence of helicity on
numerically simulated convective storms. Mon. Wea. Rev., 121, 2005-2029.
Fawbush, E. J., R. C. Miller, and L. G. Starrett, 1951: An empirical method of forecasting tornado
development. Bull. Amer. Meteor. Soc., 32, 1-9.
_____, and _____, 1952: A mean sounding representative of the tornadic airmass environment. Bull.
Amer. Meteor. Soc., 33, 303-307.
_____, and _____, 1954: The types of airmasses in which North American tornadoes form. Bull.
Amer. Meteor. Soc., 35, 154-165.
Hart, J. A., and W. D. Korotky, 1991: The SHARP Workstation - v1.50. A Skewt/Hodograph
Analysis and Research Program for the IBM and compatible PCS. User's manual. NOAA/NWS
Forecast Office, Charleston, WV, 62 pp.
Jahn, D. E., and K. K. Droegemeier, 1996: Simulation of convective storms in environments with
independently varying bulk Richardson Number shear and storm-relative helicity. Preprints, 18th
Conf. on Severe Local Storms, San Francisco, CA, Amer. Meteor. Soc., 230-234.
Johns, R. H., J. M. Davies, and P. W. Leftwich, 1993: Some wind and instability parameters
associated with strong and violent tornadoes, 2. Variations in the combinations of wind and
instability parameters. The Tornado: Its Structure, Dynamics, Prediction and Hazards, Geophys.
Monogr., No. 79, Amer.Geophys. Union, 583-590.
_____, and C. A. Doswell III, 1992: Severe local storms forecasting. Wea. Forecasting, 7, 588-612.
Kerr, B. W., and G. L. Darkow, 1996: Storm-relative winds and helicity in the tornadic thunderstorm
environment. Wea. Forecasting, 11, 489-505
Klemp, J. B., and R. Rotunno, 1983: A study of the tornadic region within a supercell thunderstorm.
J. Atmos. Sci., 40, 359-377.
Klemp, J. B., 1987: Dynamics of Tornadic Thunderstorms. Ann. Rev. Fluid Mech., 19, 369-402.
Lemon, L. R., 1977: New severe thunderstorm radar identification techniques and warning criteria:
A preliminary report. NOAA Tech. Memo. NWS NSSFC-1, 60pp.
Lilly, D. K., 1986: The structure, energetics and propagation of rotating convective storms. Part II:
Helicity and storm stabilization. J. Atmos. Sci., 43, 126-140.
Maddox, R. A., 1976: An evaluation of tornado proximity wind and stability data. Mon. Wea. Rev.,
104, 133-142.
Meier, K., 1994: PCGRIDDS user's manual (12/93 version). [Available from NOAA/NWS Southern
Region Scientific Services Division, Fort Worth, TX, 76102.]
Moncrieff, M. W., and J. S. A. Green, 1972: The propagation and transfer properties of steady
convective overturning in shear. Quart. J. Roy. Meteor. Soc., 98, 336-352.
Rasmussen, E. N., J. M. Straka, R. Davies-Jones, C. A. Doswell III, F. H. Carr, M. D. Eilts, and D.
R. MacGorman, 1994: Verification of the Origins of Rotation in Tornadoes Experiment: VORTEX.
Bull. Amer. Meteor. Soc., 75, 995-1006.
_____, and J. M. Straka, 1997: Supercell morphology variations. Part 1. Observations of upper-level
storm-relative flow. Mon. Wea. Rev.; accepted for publication.
Rotunno, R., and J. B. Klemp, 1985: On the rotation and propagation of simulated supercell
thunderstorms. J. Atmos. Sci., 42, 271-292.
Stensrud, D. J., J. V. Cortinas Jr., H. E. Brooks, 1997: Discriminating between tornadic and
nontornadic thunderstorms using mesoscale model output. Wea. Forecasting, 12, 613-632.
Wakimoto, R. M., and J. W. Wilson, 1989: Non-supercell tornadoes. Mon. Wea. Rev., 117, 1113-1140.
Weisman, M. L., 1996: On the use of vertical wind shear versus helicity in interpreting supercell
dynamics. Preprints, 18th Conf. on Severe Local Storms, San Francisco, CA, Amer. Meteor. Soc.,
200-204.
_____, and J. B. Klemp, 1982: The dependence of numerically simulated convective storms on
vertical wind shear and buoyancy. Mon. Wea. Rev., 110, 504-520.
_____, and _____, 1984: The structure and classification of numerically simulated convective storms
in directionally varying wind shears. Mon. Wea. Rev., 112, 2479-2498.
_____, and _____, 1986: Characteristics of isolated convective storms. Mesoscale Meteorology and
Forecasting, P. S. Ray, Ed., American Meteorological Society, 331-358.
Wicker, L. J., 1996: The role of near surface wind shear on low-level mesocyclone generation and
tornadoes. Preprints, 18th Conf. on Severe Local Storms, San Francisco, CA, Amer. Meteor. Soc.,
115-119.
_____, and R. B. Wilhelmson, 1995: Simulation and analysis of tornado development and decay
within a three-dimensional supercell thunderstorm. J. Atmos. Sci., 52, 2675-2703.